Primary school pupils in England take part in the:
- Reception baseline assessment: within the first 6 weeks of entering reception
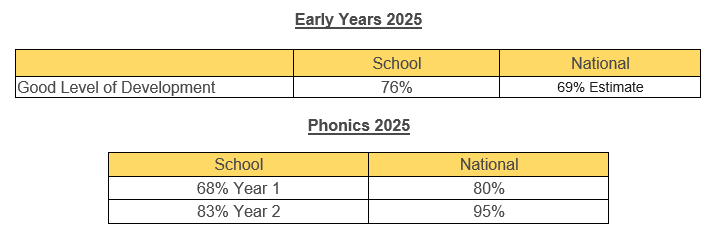
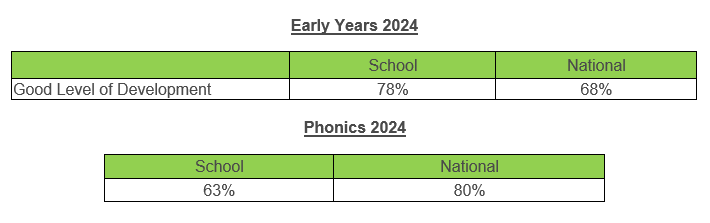
- Early years foundation stage profile assessment: between April and June of the academic year in which they turn 5 (usually the reception year)
- (Reception Baseline Assessment: Information for Parents)
- Phonics screening check: in June of year 1
- (Phonics Screening: Information for Parents)
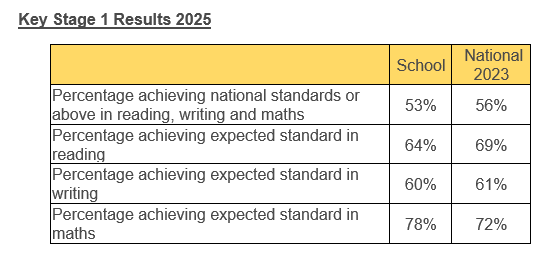
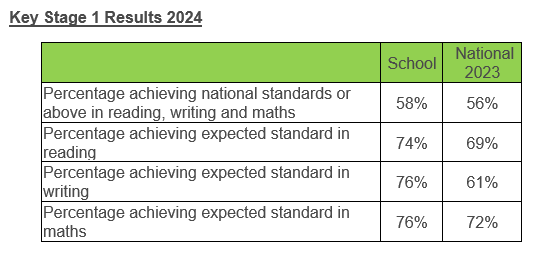
- Key stage 1 tests: optional, at the school’s discretion, at the end of year 2
- (KS1 Optional Tests: Information for Parents)
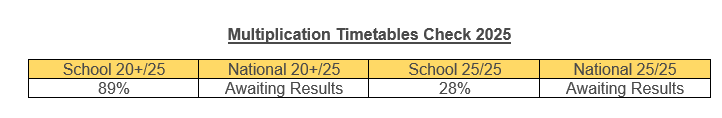
- Multiplication tables check: in June of year 4
- (Multiplication Checks: Information for Parents)
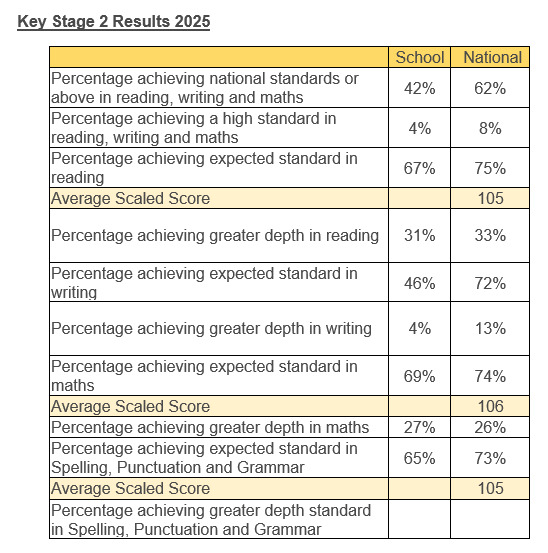
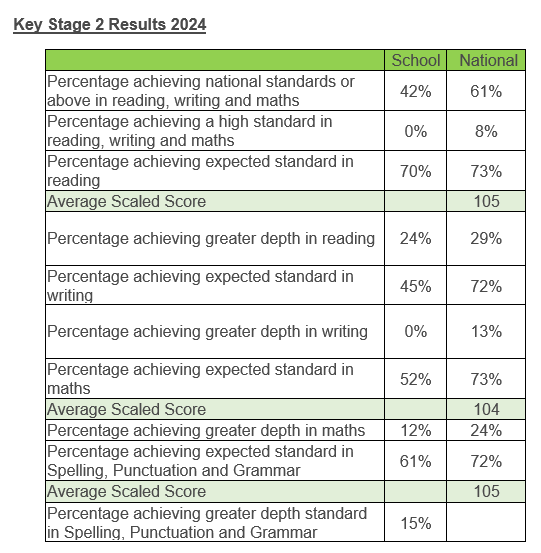
- Key stage 2 tests (sometimes referred to as SATs): in May of year 6
- (Year 6 SATs: Information for Parents)